You have no items in your shopping cart.
ADDITIONAL FEATURES
Welcome – Visualize All Amazon Seller Data, At a Glance
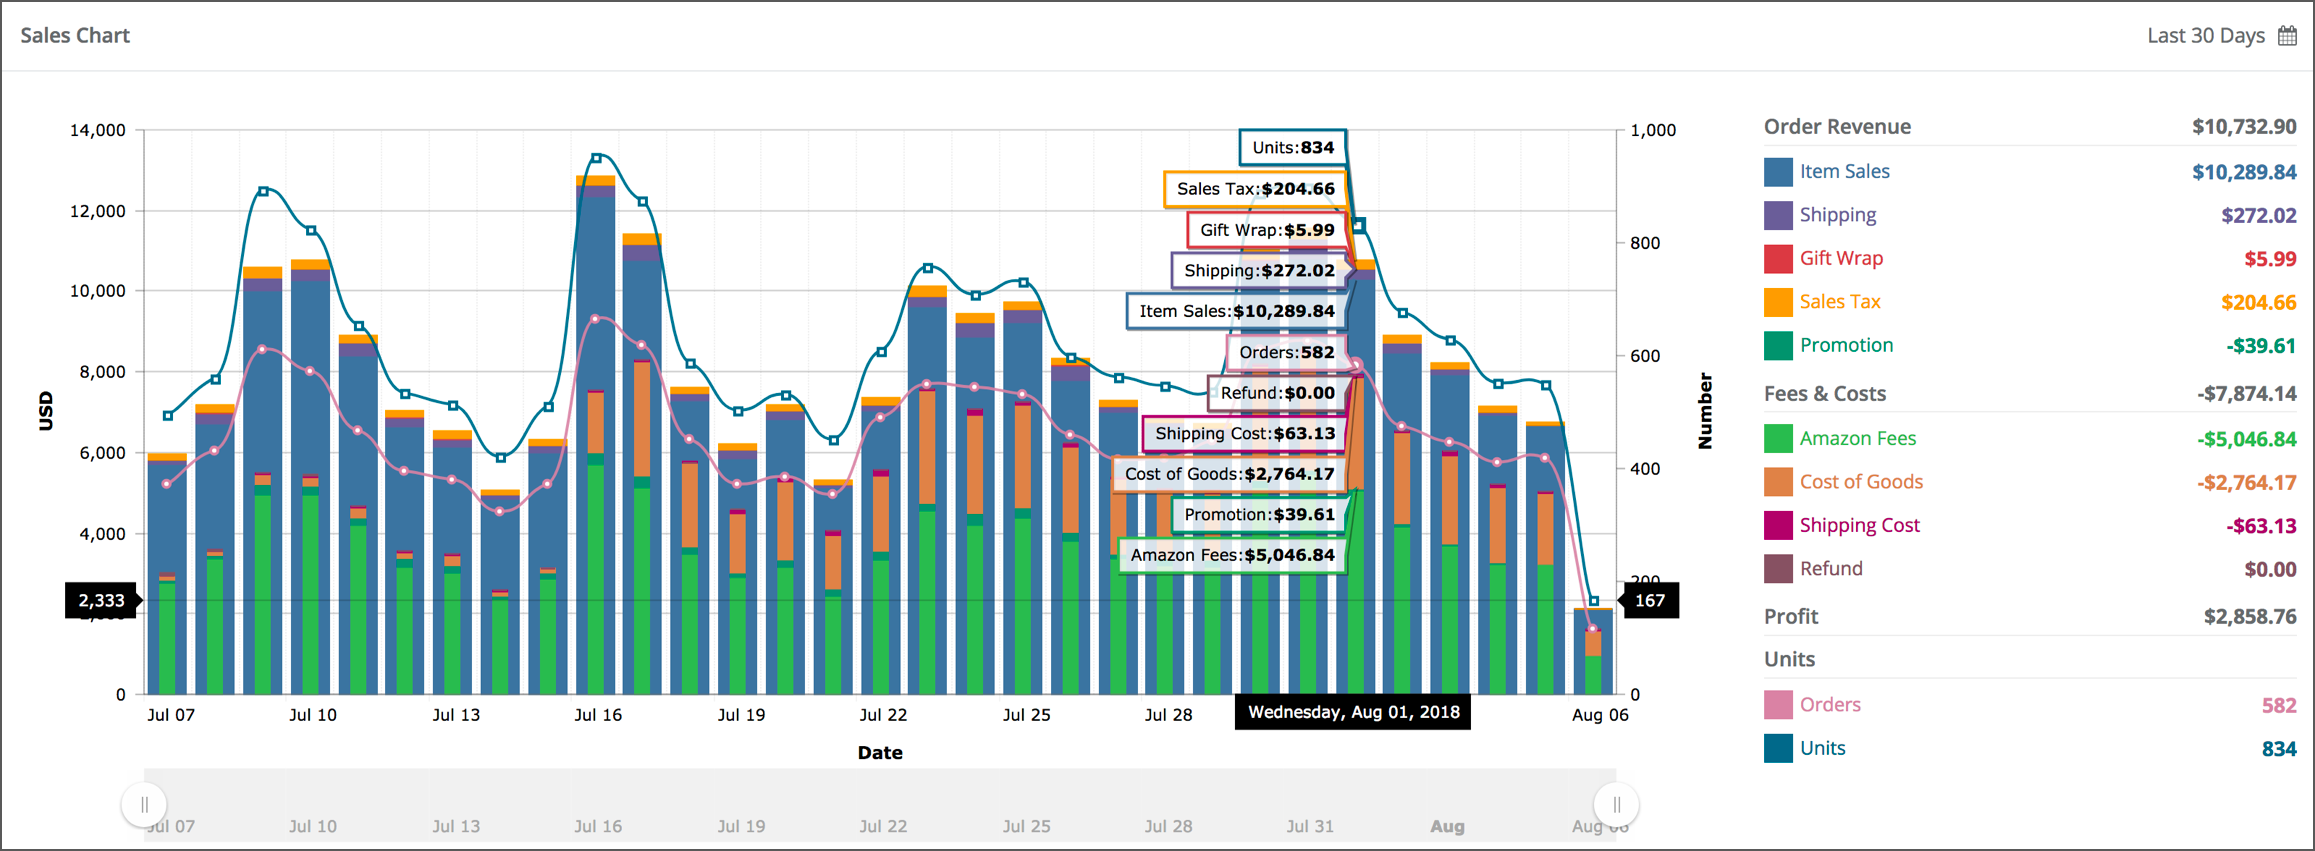
Our dashboard provides easy-to-understand and real-time data visuals and reports, aimed to simplify your Amazon account data into more manageable blocks of visual information. When utilized effectively, this dashboard can help you make informed business decisions that can dramatically impact your bottom line.

Year-over-year (YOY) Analysis
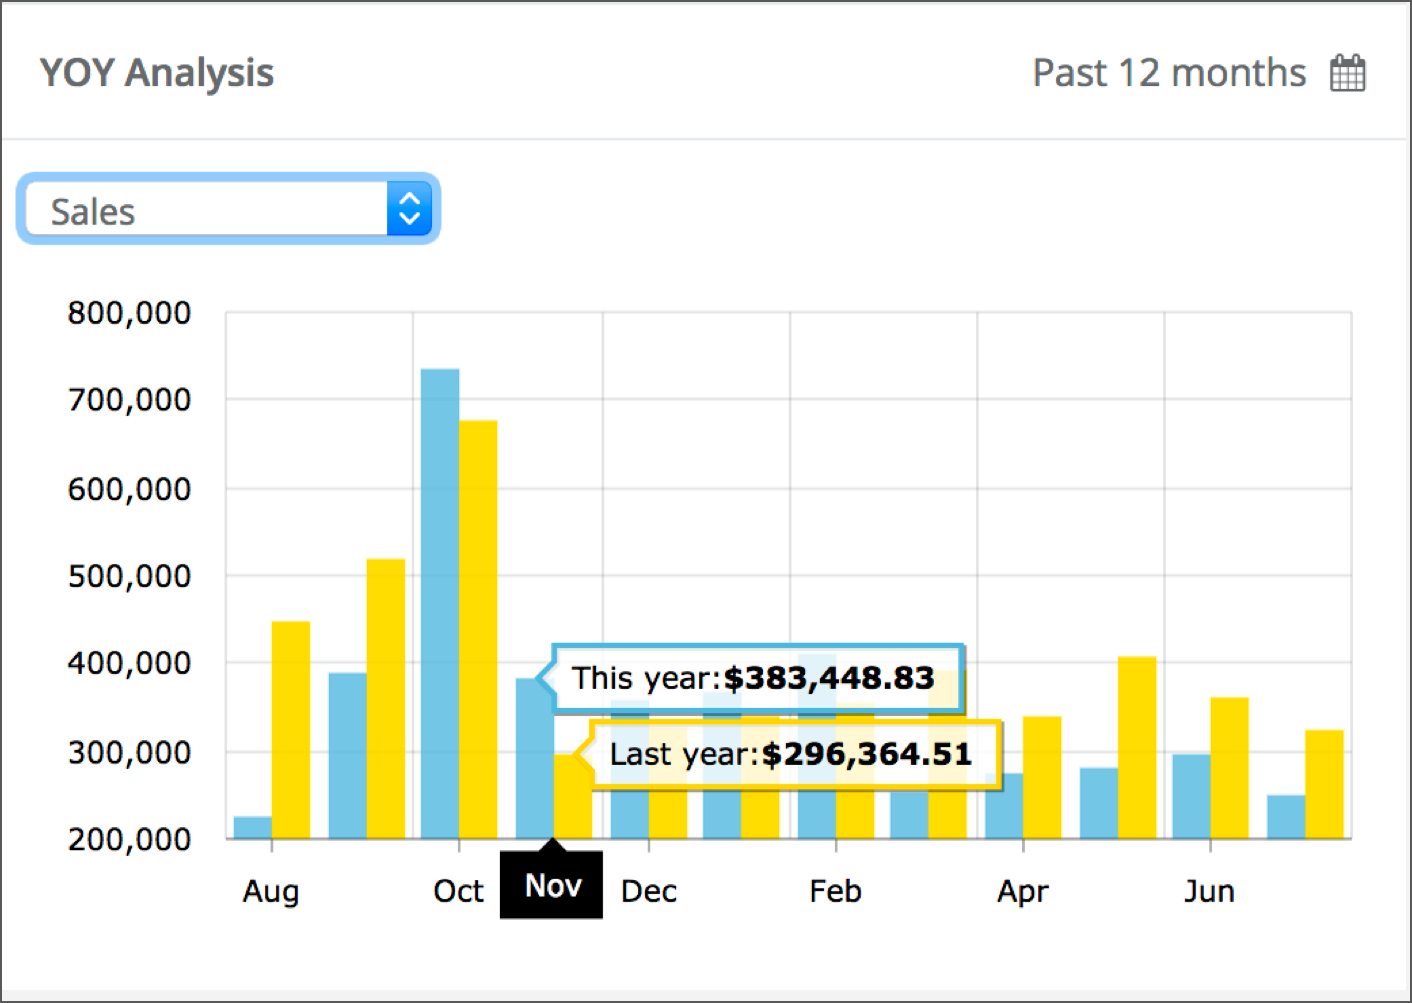
Year-over-year (YOY) Analysis compares the total USD, for four different measures, at one-time period with that of a comparable time period on an annualized basis. YOY analysis will help gauge whether your totals in sales, Amazon fees, promotions and profits are increasing and improving or worsening.
You can choose to view a monthly comparison, over the course of 12 months, for sales, Amazon fees, promotions and profit.

Additional totals (for selected time frame) are provided to the right of the revenue, sales and profit information.
- Tested for Magento version 2.x.
- Easy to install & configure.
- Avoids more complexity.
- Orders: all orders placed.
- Units: total units sold within all orders.
- Promo: promotional discounts given within total orders.
- Refunds: total refunds from all orders.
- Fees: Amazon fees collected within total orders placed.
- Gross margin: calculated by revenue minus the fees and cost.


